What Do Sine Functions Look Like?
What does the graph of a sine function look like? And how are sine functions related to the changing number of daylight hours throughout the year? Keep on reading to find out!
Jason Marshall, PhD
Listen
What Do Sine Functions Look Like?

After talking about the astronomy behind this periodic pattern of daylight hours last week, I somewhat cryptically mentioned that if you were to make a graph of daylight hours throughout the year, you’d obtain something that looks an awful lot like a sine function.
But what exactly does the graph of a sine function look like? And how is it related to the varying number of daylight hours? Those are exactly the questions we’ll be answering today!
.
Sine = Opposite / Hypotenuse

As you’ll recall, the sine of an angle in a right triangle is simply the ratio of the length of the side opposite the angle to the length of the hypotenuse. You can remember this using the first part of “SOH-CAH-TOA” which says that “sine = opposite / hypotenuse”.
Once you know this, all you need to do to figure out what the graph of a sine function looks like is think about how this ratio changes as you increase or decrease the angle in the right triangle.
The Sine Function at Tiny Angles
Imagine a right triangle in which one of the angles is extremely small—not quite zero degrees, but pretty close. What’s the sine of this tiny angle? Well, the sine is the length of the side opposite the angle to the length of the hypotenuse. If you think about it (and perhaps draw a picture), you’ll see that since the angle is almost zero the length of the opposite side must also be close to zero. Which means that no matter what the length of the hypotenuse, the sine of this tiny angle must be very close to zero. And the smaller you make the angle, the closer the sine of the angle must be to zero.
The smaller you make the angle, the closer the sine of the angle must be to zero.
Now imagine increasing the size of the angle a tiny bit. What happens to the sine of the angle? Well, the length of the side opposite the angle begins to increase relative to the hypotenuse as the angle increases, so the sine of the angle also increases. As the angle becomes larger and larger—15 degrees, 30 degrees, 45 degrees, and so on—the sine of the angle also becomes larger and larger.
The Minimum and Maximum Values of Sine
What happens as the angle increases yet further? As the angle grows, the length of the opposite side begins to approach the length of the hypotenuse (draw a picture to convince yourself). And as the angle approaches 90 degrees (aka, π/2 radians), the sine of the angle approaches a value of 1. Why? Because the opposite side gets closer and closer until it’s eventually sitting on top of the hypotenuse. In other words, as the angle approaches 90 degrees, the lengths of the opposite side and the hypotenuse get closer until their ratio reaches 1 at 90 degrees.
What happens after 90 degrees? Unfortunately, this is where our right triangle begins to fail us—at least in terms of providing a simple way to think about the sine function. After all, once the angle we’re looking at extends beyond 90 degrees, we’re no longer talking about a right angle. But it did get us from zero up to the maximum value of the sine function—which isn’t too shabby!
What Does Sine Look Like?
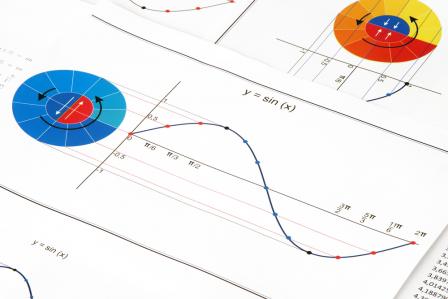
How do I know that sine has a maximum value at 90 degrees? Because I happen to know another way to think about the sine function that makes it obvious. Instead of picturing a lonely right triangle, the trick is to think about a right triangle sitting inside a unit circle (a circle with a radius equal to 1) that intersects the x and y axes at points 1 and -1 in both directions.
The beauty of this setup is that the hypotenuse of our embedded triangle is the same as the radius of the unit circle—in other words it’s 1. Which means the sine of the angle in our triangle is simply equal to the triangle’s “height” along the y-axis since that’s the “opposite” side.
With this in mind, starting with an an angle of zero, we see that the sine of zero is equal to zero (since the triangle is squashed on top of itself along the x-axis). As we increase the angle, the sine of the angle grows. And, as we saw before, when we reach an angle of 90 degrees, the height along the y-axis—and thus the value of sine—reaches its maximum value.

In other words, the sine function oscillates between a maximum and a minimum value over and over again in a predictable and periodic fashion. Sound familiar?
The Sinusoidal Nature of Daylight Hours
Indeed, the same characteristics we’ve seen in the sine function are also found in the pattern of increasing and decreasing numbers of daylight hours we experience year after year. In fact, if you plot the number of daylight hours next to a properly scaled sine function, you’ll see that the two match quite closely.
Is that an accident? No, not at all. It’s math.
Wrap Up
Okay, that’s all the math we have time for today.
Please be sure to check out my book The Math Dude’s Quick and Dirty Guide to Algebra. And remember to become a fan of the Math Dude on Facebook where you’ll find lots of great math posted throughout the week. If you’re on Twitter, please follow me there, too.
Until next time, this is Jason Marshall with The Math Dude’s Quick and Dirty Tips to Make Math Easier. Thanks for reading, math fans!
Sine image and sine graph from Shutterstock.

